US Agricultural Analysis
Exploring Long-Term Trends in U.S. Agriculture using large scale USDA datasets.
01.Project Overview
Overview
This project is an interactive data analysis and visualization framework designed to explore long-term trends in U.S. agriculture using large-scale public datasets from the USDA QuickStats program. The application emphasizes data-driven storytelling, visual design principles, and context-aware interactivity to surface non-obvious insights about agricultural production, land use, labor, and farm operations.
The deployed application represents a demo version of a broader analytical system, showcasing selected views and design patterns under deployment and memory constraints.
Project Motivation
U.S. agriculture operates at the intersection of economics, land management, labor availability, and technological change. While USDA data is publicly available, it is often difficult to explore holistically due to:
- Large data volume
- High dimensionality
- Heterogeneous reporting structures
- Limited narrative context in static tables
This project transforms raw agricultural data into an interactive analytical product that enables users to explore trends, compare regions, and reason about structural changes over time.
Analytical Focus
The analysis is organized around several core themes:
Production and Yield
-How crop output and efficiency evolve across time and geography
Land Use and Area
-Shifts in cultivated land and crop allocation
Labor and Farm Operations
-Changes in labor intensity, operational density, and consolidation patterns
Temporal Trends
-Long-term changes rather than short-term fluctuations
Rather than answering a single question, the dashboard is designed as an exploratory decision-support tool.
Data
- Source: USDA QuickStats
- Coverage: U.S. agriculture (multi-year, multi-state)
- Granularity: State- and county-level data (varies by dataset)
- Scale: Millions of records across multiple datasets
- Storage: External object storage (S3) for scalability
Significant preprocessing is required to harmonize measures, normalize units, and support responsive visualization.
Application Design and Interactivity
The dashboard is built with a focus on:
- Shared filters for consistent cross-view comparisons
- Contextual tooltips and annotations to guide interpretation
- Thoughtful use of color, scale, and layout
- Minimizing visual clutter while preserving analytical depth
Design decisions follow established visualization principles, including:
- Appropriate use of marks and channels
- Avoidance of misleading encodings
- Accessibility considerations (e.g., color usage)
Demo vs Full Application
The deployed application is a constrained demo that illustrates the core analytical approach and visualization logic.
Demo characteristics
- Subset of full datasets
- Selected views and interactions
- Optimized for limited deployment resources
Full project (local / expanded environment)
- Additional datasets and views
- Larger temporal and geographic coverage
- More extensive interactivity and derived metrics
This separation allows the demo to remain responsive while preserving the integrity of the full analytical pipeline.
Project Visuals
The application includes a variety of visual forms, such as:
- Line charts for long-term trends
- Bar and ranked views for comparative analysis
- Geographic representations for spatial context
- Interactive filters for state, year, and commodity selection
Visuals are designed to support insight discovery, not just presentation.
Sample analysis output (labor):
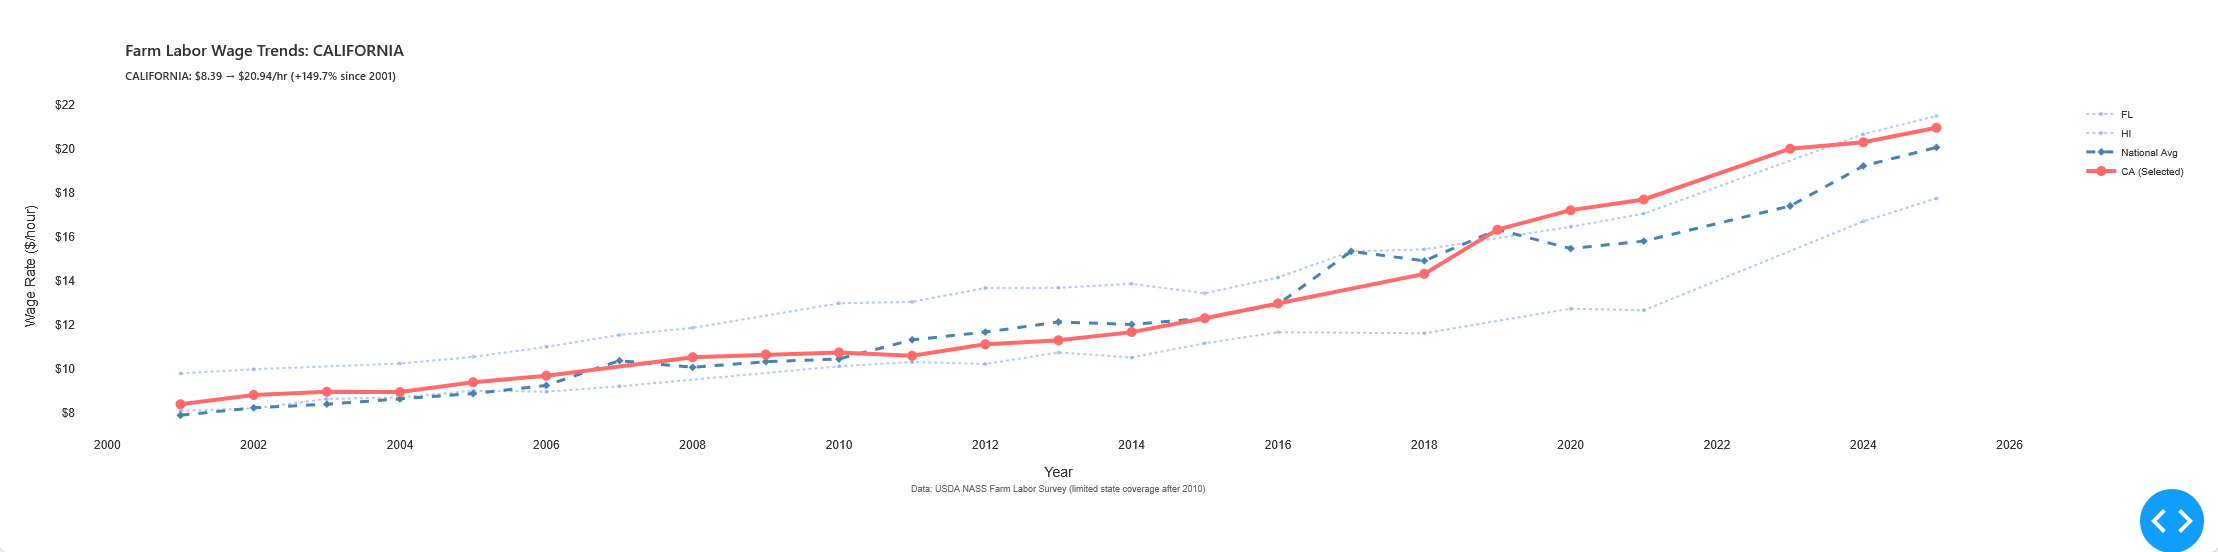
Figure: Labor wage and employment statistics, highlighting national differences and long-run shifts.
Repository Structure
Agricultural_Data_Analysis/
├── data/                # Processed datasets and schemas
├── app.py               # Main Dash application
├── data_prep.py         # Data loading and preprocessing logic
├── visuals.py           # Visualization construction
├── assets/              # Styling and static assets
└── README.md
Key Insights Enabled
This framework allows users to:
- Identify crops with disproportionate growth or decline
- Observe regional specialization and divergence
- Compare land use intensity across states
- Understand how labor and operations scale relative to output
- Explore long-term structural change in U.S. agriculture
Tech Stack
- Python
- Dash / Plotly
- Pandas, NumPy
- AWS S3 (data storage)
- HTML/CSS (light styling)
Notes
This repository reflects a design-driven analytical project that prioritizes interpretability, scalability, and narrative clarity. While originally developed in an academic context, the structure and methodology are intended to generalize to real-world analytical and policy exploration settings.
Technologies
Role
Data Analyst
Timeline
March 2026
Category
Data Science